
Shrestha Bhattacharya

3+ years as a data engineering professional, now trying to break into data science — MS Analytics at Georgia Tech, previously building data pipelines at Cognizant.

Portrait of Shrestha Bhattacharya

Projects

Selected Projects

Advertising Incrementality & Uplift Modeling

Does an ad campaign cause incremental conversions — and whose? A complete causal-inference project: a network-interference simulation, a randomization audit, and uplift modeling on 14 million real users, with uncertainty on every number.

A/B Tests With 32% Fewer Users: Variance Reduction & Safe Early Stopping

How many users does a test really need, and what happens when you check it early? Variance reduction and sequential testing on a real 200,000-customer experiment, verified against simulations where the true effect is known.

Testing a Ride-Hail Promotion When Riders Compete for Drivers: Switchback Experiments on 19.7M NYC Trips

When riders compete for the same drivers, a standard A/B test of a promotion measures the wrong thing. A simulation built from 19.7 million real NYC ride-hail trips shows how large the error is, and what a time-window (switchback) design recovers and costs.

Experiment Doctor: Automated A/B Test Diagnostics

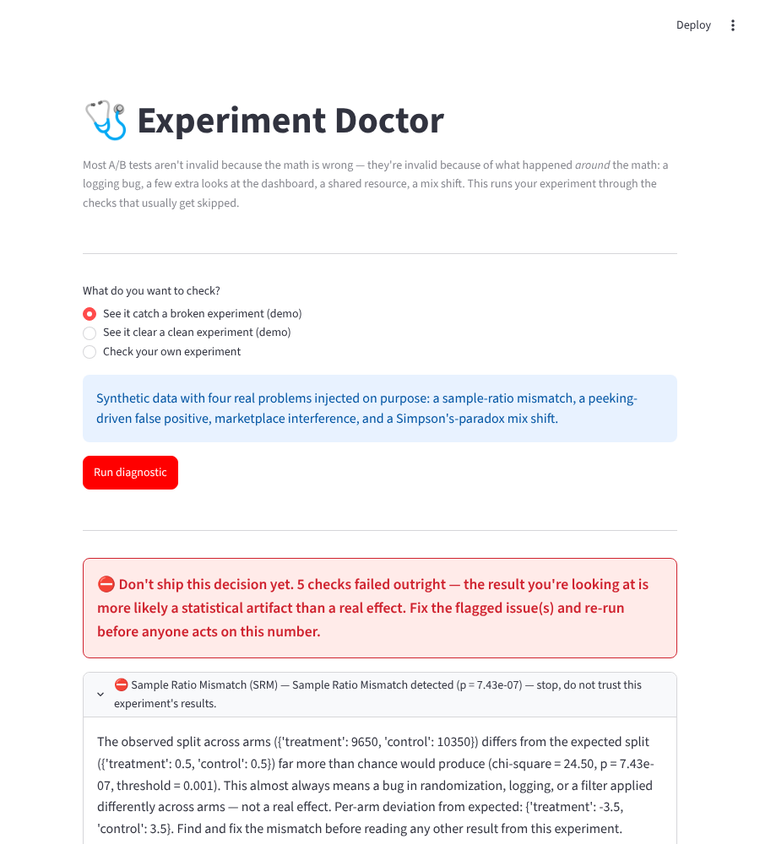
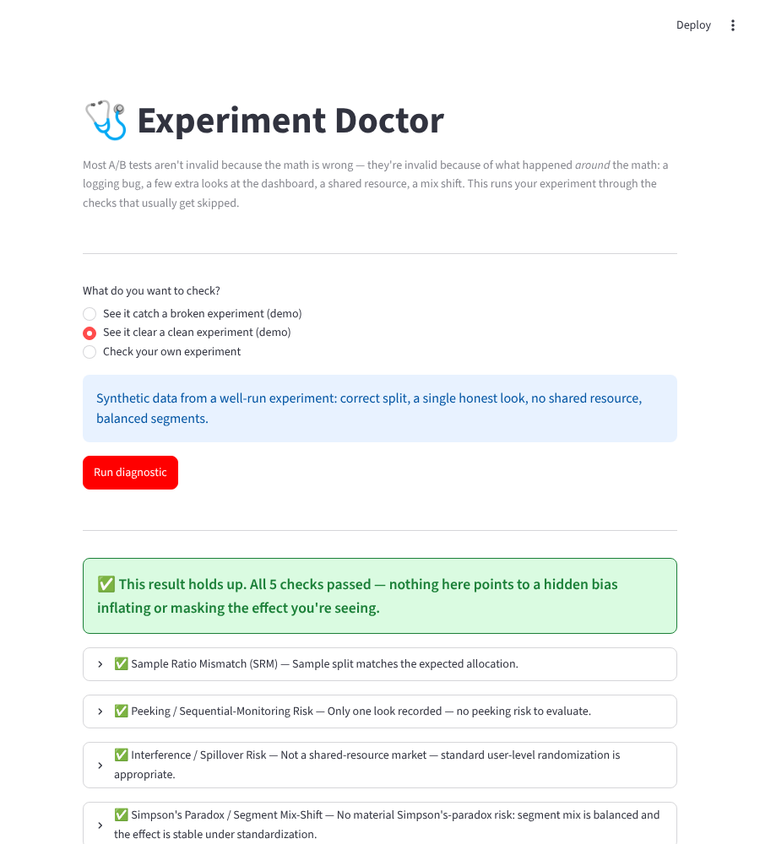
Most A/B tests aren't invalid because the math is wrong — they're invalid because of what happened around the math: a logging bug that skewed the split, a few extra looks at the dashboard, a shared resource, a segment mix that shifted. Built a tool that runs five checks for exactly those problems — sample ratio mismatch, peeking, interference, Simpson's paradox, missed CUPED opportunity — and returns a plain-English verdict instead of a wall of p-values.

Research

arXiv · 2026

Variance-Reduced Streaming PCA with Parameter-Free Momentum

Shrestha Bhattacharya

TL;DR: Oja's algorithm for streaming PCA is noisy because every step uses a rank-one gradient. VR-OJA keeps a bias-corrected moving average of those gradients, with a parameter-free momentum default β⋆ = 1 − k/p. It cuts final subspace error by 22–27% over OJA-QR on synthetic streams, and on the S&P 500 benchmark gives 24–47% error reduction at 10× the base learning rate.

DS Case Studies

Interactive explainers

DS Case Study · Simplified model

The shortcut that saves you 17 minutes stops saving anyone time once everyone takes it.

A navigation app suggesting a faster route, shown with a simplified model. Drag the slider.

Navigation apps suggest the faster route to each driver. If only a few drivers follow, the shortcut really is fast. But every driver who takes it slows it down, and clears the main road behind them. A test on a small share of drivers measures the left edge of this chart, not what happens when everyone follows the advice. It is the same interference problem I simulate in the marketplace project above: one user's treatment changes the conditions for the others.

Main road34.5 min
Suggested shortcut17.0 min
Average driver33.6 min

Before the app suggested the shortcut, everyone took the main road: 35 minutes.

The shortcut still saves 17.5 minutes over the main road. A small pilot would report exactly this number, and it would be right for the pilot.

Simplified two-road model with made-up travel times (shortcut: 15 min + 40 min × share of drivers on it; main road: 25 min + 10 min × share still on it). It illustrates the idea. It does not describe how Google Maps routes drivers and uses no Google data.

DS Case Study · Simulated numbers

Orders went up after free delivery. Did the promotion work?

A food-delivery promotion, shown with simulated numbers. Toggle the view.

When a promotion launches, orders go up. But some of those orders would have happened anyway, and some are only pulled forward from the following weeks. The way to tell is a holdout group: users who were eligible but deliberately left out. It is the same idea behind the ad experiment above: compare against what would have happened anyway, not against last week.

Last week, before the promotion12,000 orders
12,000
Promo week, users with free delivery14,000 orders
14,000
Promo week, holdout users without it12,500 orders
12,500
Got free delivery (10,000 users) Holdout, did not (10,000 similar users)

Compared with last week, orders are up 17%. But the holdout group, who got no promotion, also ordered more than last week (12,500), so the promotion's real effect that week was +12%: 1,500 extra orders, not 2,000.

Simulated illustration with made-up numbers, not data from any company. In a real test the holdout is chosen at random before the promotion starts.

Experience

Work

2021 - 2024

Associate at Cognizant Technology Solutions

SQL data pipelines for brokerage and insurance claims data · Informatica PowerCenter, AQT, Autosys

Education

Degrees

2025 - 2027

M.S. in Analytics at Georgia Institute of Technology

Computational Data Analytics Track · GPA 3.83/4.00 · Expected Aug 2027

2017 - 2021

B.Tech in Computer Science & Engineering at University of Engineering & Management

Kolkata, India · CGPA 8.58/10.00