 Shrestha Bhattacharya
Project · Open-source tooling
Experiment Doctor: Automated A/B Test Diagnostics
Most A/B tests aren't invalid because the math is wrong — they're invalid because of what happened around the math. A tool that runs an experiment through five checks for exactly that, and returns a plain-English verdict instead of a wall of p-values.
The three projects above each surfaced a different way an A/B test can quietly lie: marketplace interference inflating a promotion's effect, variance and peeking costing power or inflating false positives, a biased randomization check. Each time, the fix was a specific statistical check run by hand. Experiment Doctor packages those checks — plus two more (sample ratio mismatch and Simpson's paradox) — into one reusable tool, so the audit doesn't have to be rebuilt from scratch for every new experiment.
Part 1 · The five checks
What it looks for, and how
Each check returns a pass, warn, or fail with a plain-English headline and the statistic behind it — never just a verdict with no way to verify it.
| Check | What it catches | Method |
|---|---|---|
| Sample Ratio Mismatch | Randomization/logging bugs that skew the arm split | Chi-square goodness-of-fit at α = 0.001 (Fabijan et al. 2019) |
| Peeking / sequential monitoring | False positives from checking results early | O'Brien-Fleming boundaries, Monte Carlo-calibrated |
| Interference / spillover | Marketplace effects biasing user-level randomization | Randomization-unit + served-share heuristic, informed by the switchback project above |
| Simpson's paradox | Aggregate effects that are really a mix-shift | Segment-mix balance test + pooled-weight standardization |
| CUPED opportunity | Power left on the table by skipping a pre-period covariate | Variance-reduction estimate from corr(Y, X) (Deng et al. 2013) |
Part 2 · Proving it isn't just crying wolf
Same pipeline, two experiments
A tool that always says "fail" is useless. To check that it only flags real problems, I ran it on two synthetic experiments built with the same code: one with four problems injected on purpose (a 3.5% sample-ratio skew, a peeking-driven false positive found by simulating 500 true-null draws until one crossed the naive significance threshold early, a tight-supply shared-resource market randomized at the user level, and a segment mix shift that flips the sign of the raw effect), and one run clean.
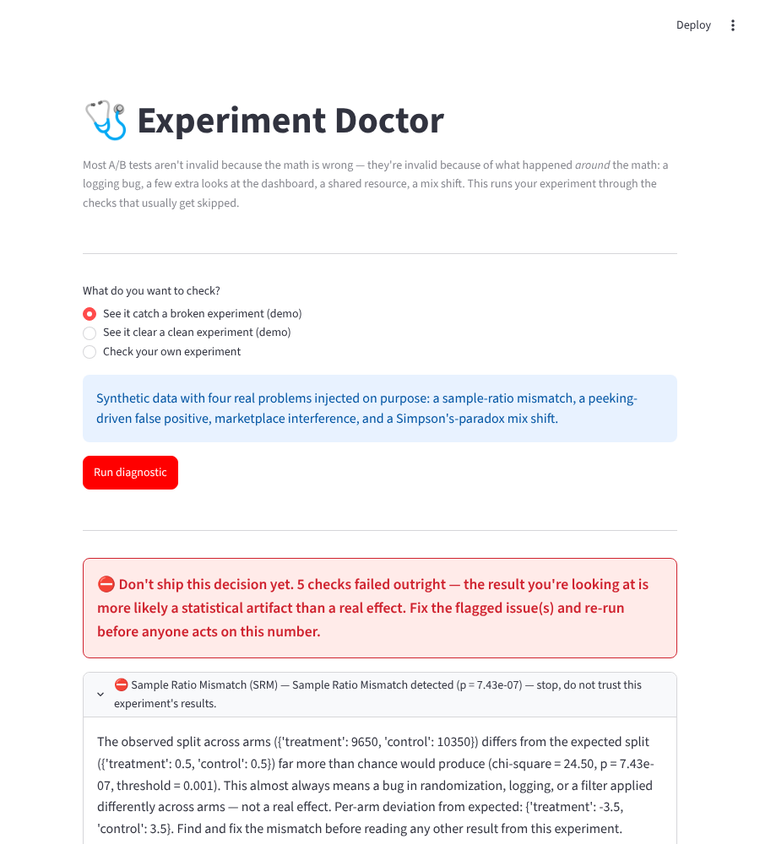
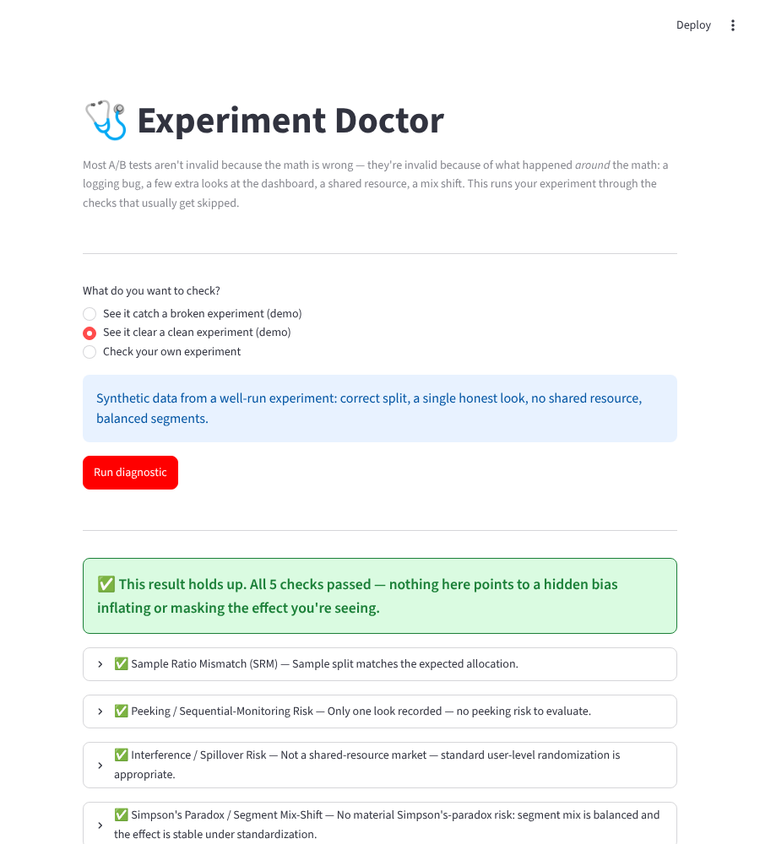
The broken demo's interference check reuses the 3.3x overstatement figure from the switchback project above — not a new number, the same validated result applied as a structural rule of thumb.
Scope & Assumptions
- Synthetic demo data only. Both demo experiments are generated with numpy — no real company or user data. The peeking false positive is a genuine draw from a true-null simulation (seed search over 500 draws), not a hand-picked number.
- Standard thresholds, not novel statistics. The SRM and CUPED checks use published reference methods (Fabijan et al. 2019; Deng et al. 2013); the interference check is a heuristic rule of thumb, not a formal test, and says so in its own output.
- Built for triage, not a replacement for judgment. A "pass" on all five checks means none of these five specific failure modes is detected — it isn't a guarantee the result is causally correct.
- Source is public, hosted demo is next. Full code and methodology are on GitHub, runnable locally with streamlit run app.py; a one-click public demo (Streamlit Community Cloud) is the next step.